
Figure 4.
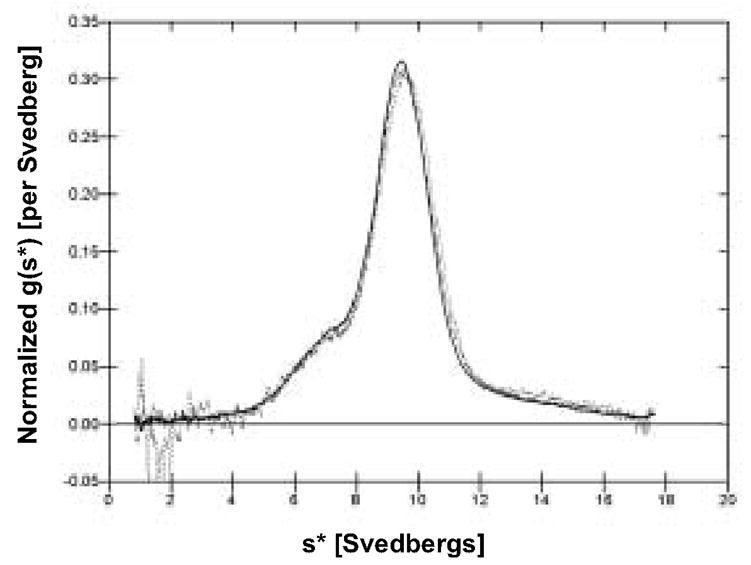
Sedimentation analysis of hFcILZOX40L. Sedimentation was performed at three concentrations, 1.18 mg/ml (solid line), 0.46 mg/ml (dashed line) and 0.15 mg/ml (dotted line). The overlaid plots of the frequency distribution of molecules with different sedimentation coefficients [normalized g(s*) versus s*] are presented. Superimposition of sedimentation profiles at all three concentrations indicates a non-interacting system and validates the determination of the sedimentation coefficient and the molecular weight. Time-derivative analysis (Stafford, 1992) was performed on the sedimentation velocity concentration profiles to obtain g(s*) profiles using the program, DcDt+, Version 2.07 (Philo, 2006).