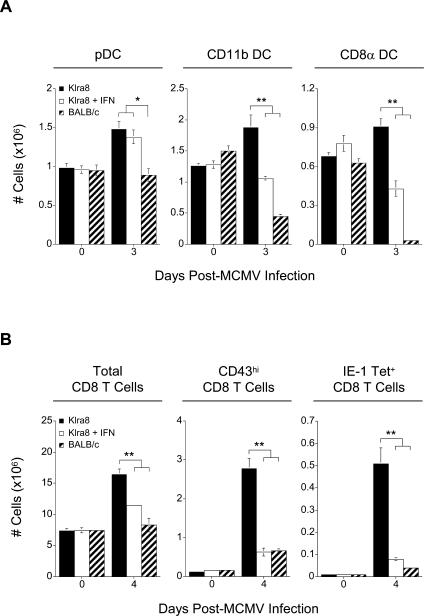
Figure 6. IFN-α-Driven Loss of cDCs and Delay in CD8 T Cell Activation.
(A) Splenic leukocytes were isolated on days 0 and 3 post–MCMV infection from Klra8, Klra8 treated with IFN-α at 30 and 48 h post-infection, and BALB/c mice. The total numbers (in millions) of pDCs, CD11b cDCs, and CD8α cDCs were determined and are presented as in Figure 2.
(B) Splenic leukocytes were isolated on days 0 and 4 post–MCMV infection from Klra8, Klra8 treated with IFN-α at 30 and 48 h post-infection, and BALB/c mice. Total numbers (in millions) of CD8 T cells, CD43hi CD8 T cells, and IE-1 tetramer+ CD8 T cells were determined and are presented as in Figure 3.
One experiment representative of two for (A, B) is shown. *p ≤ 0.05; **p ≤ 0.01.

