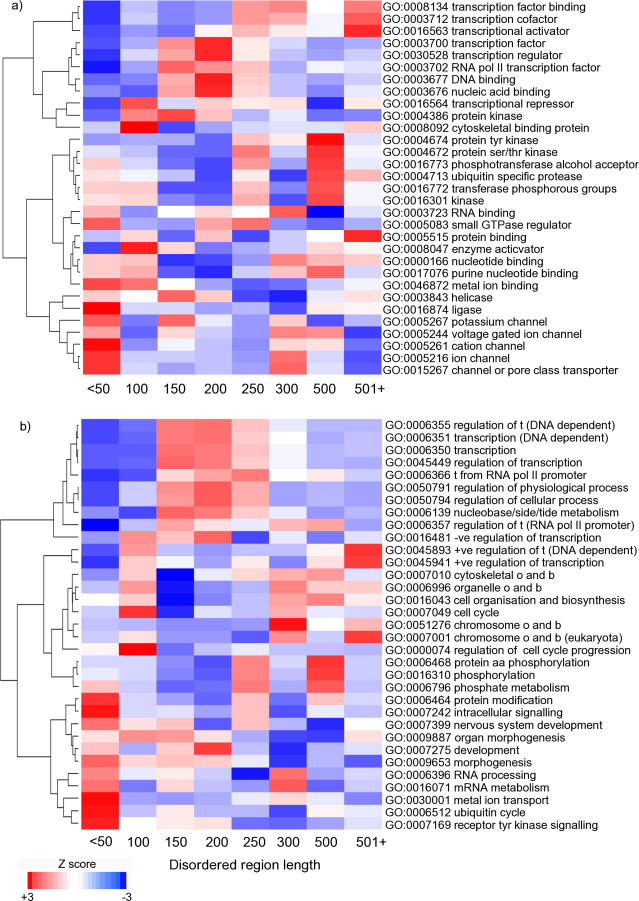
Figure 3. Length Dependence of Disordered Protein Functions for Molecular (A) Function Categories and Biological Process (B) Categories Enriched in Disordered Proteins.
The x-axis ranges represent ranges of disordered residue lengths; 1–50, 51–100, 101–150, 151–200, 201–250, 251–300, 301–500, and 501+. The clustering was performed using Ward's hierarchical clustering method [30]. The heatmap colours reflect the significance of the association between the frequency of disordered regions within a length range and the GO category. Red blocks indicate a significant association between high average frequency of disordered regions and GO category, and blue blocks indicate a significant association between low average frequency of disordered regions and GO category.

