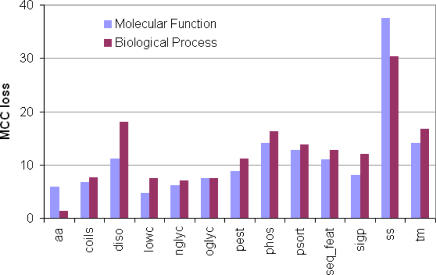
Figure 5. Relative Feature Importance.
Bar height represents median average percent loss in classifier performance for each feature group. Feature groups are abbreviated to aa (amino acid), coils (coiled coils), diso (disorder), lowc (low complexity), nglyc (n-glycosylation), oglyc (o-glycosylation), pest (PEST regions), phos (phosphorylation), psort (protein sorting), seq_feat (sequence features), sigp (signal peptide), ss (secondary structure), and tm (transmembrane regions).

