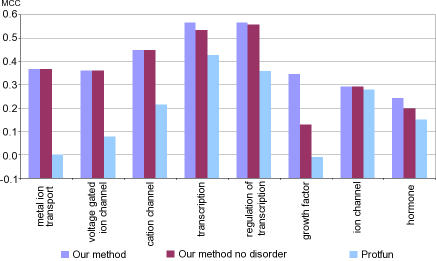
Figure 7. Benchmark Comparison Results.
Classification accuracy was assessed using Matthews correlation (y-axis) for eighty common GO categories for our method and for the ProtFun server. Results for our method without disorder features were shown to emphasize that performance improvements could also be the result of the use of more up-to-date training example data, feature-encoding strategies, and different machine learning algorithms.

