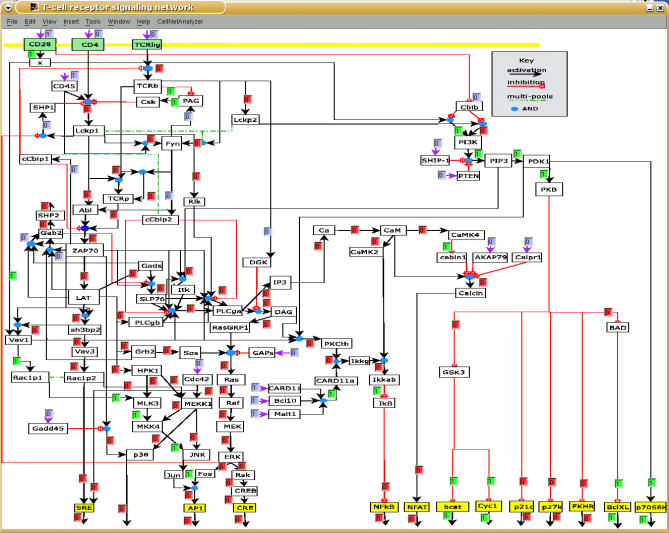
Figure 1. Logical Model of T Cell Activation (Screenshot of CellNetAnalyzer).
Each arrow pointing at a species box is a so-called hyperarc representing one possibility to activate that species (see Methods). All the hyperarcs pointing at a particular species box are OR connected. Yellow species boxes denote output elements, while green ones represent (co)receptors. In the shown “early-event” scenario, the feedback loops were switched off, and only the input for the costimulatory molecule CD28 is active (scenario in column 2 of Table 1). The resulting logical steady state was then computed. Small text boxes display the signal flows along the hyperarcs (blue boxes: fixed values prior to computation; green boxes: hyperarcs activating a species (signal flow is 1); red boxes: hyperarcs which are not active (signal flow is 0)).

