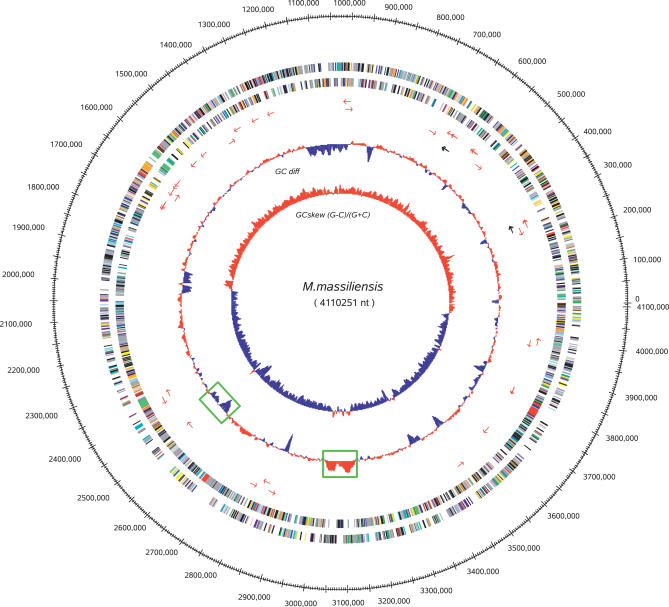
Figure 2. Map of the M. massiliensis Chromosome.
The following features are displayed (from the outside in): position along the genome, protein-coding genes along both strands colored according to COG categories, tRNA genes as red arrows, rRNA genes as black arrows, the windowed difference of GC% with respect to the average, and the GC skew (G − C)/(G + C), with positive values in red and negative values in blue. Two regions of phage insertion are indicated by green boxes.

