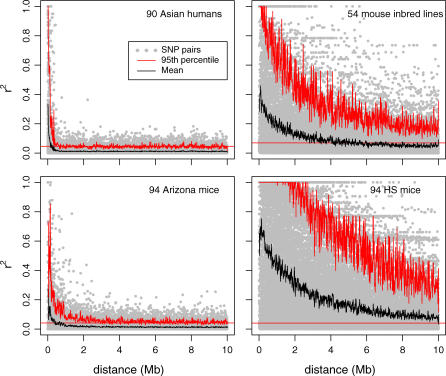
Figure 2. LD between Pairs of ∼2,900 Autosomal SNPs in Humans and Mice.
The r 2 variable is the composite (genotypic) measure of LD, which is very similar to the usual gametic measure (see Materials and Methods). The jagged red line is the 95th percentile of the r 2 values within a 25 kb sliding window. The horizontal red line is the genome-wide threshold for significance of r 2 at α = 0.05 (calculated as the 95th percentile of permuted data). The jagged black line is the mean of the r 2 values within a 25 kb sliding window. HS is an outbred laboratory strain.

