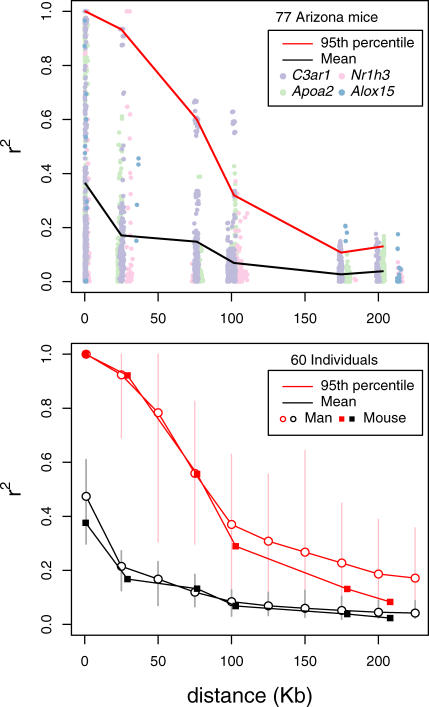
Figure 3. LD between SNPs Discovered by Resequencing in Selected Regions of the Genome, Measured as the Genotypic r 2 .
The top panel shows LD in 77 Arizona mice for pairs of SNPs within each of four regions (points) and summary statistics for all four regions combined (lines). The total number is 163 common SNPs (nine Alox15, 53 Apoa2, 70 C3ar1, 31 Nr1h3). The lines connect the midpoint of each distance bin and give either the mean or the 95th percentile of r 2 for that bin. The lower panel compares LD in 60 unrelated individuals each of Arizona mice and humans of European ancestry from the CEU sample of the HapMap project. The mouse SNPs are the same as in the top panel, except that the total number is 141 (removing those with MAF < 0.05 in the sample of 60 individuals). The human SNPs are a subset from 10 ENCODE regions, selected to have the same allelic frequency distribution as the mouse SNPs. The human SNP numbers range from 131 to 803 per region, with a total of 3891 over all ten regions. The ranges of r 2 statistics (mean or 95th percentile) for the ten ENCODE regions are given by the vertical bars.

