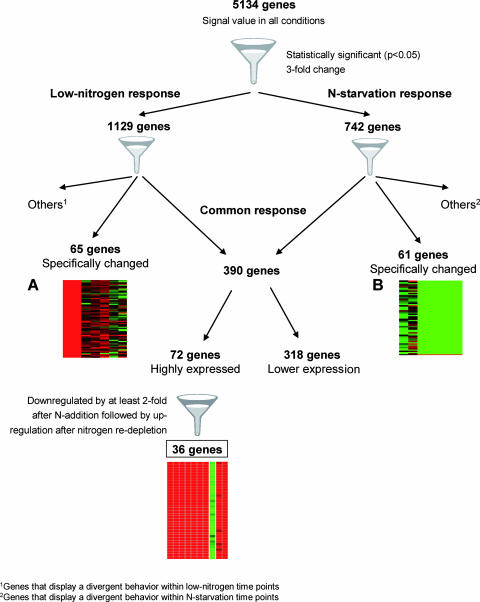
FIG. 1.
Overview of gene selection criteria. Transcript profiles of genes that specifically respond to low nitrogen (A) and to N starvation (B) under alcoholic fermentation conditions; results, log2 expression ratios obtained by dividing the experimental results by the reference sample results, are represented with a green-to-red color scale. Each expression diagram shows, from top to bottom, relative expression levels of each set of genes and, from left to right, comparisons between LN24, CF48, CF96, LN48, LN80, LN96, and LN144 and the reference cultures, CF24. Down-regulated genes are green, whereas up-regulated genes are red.

