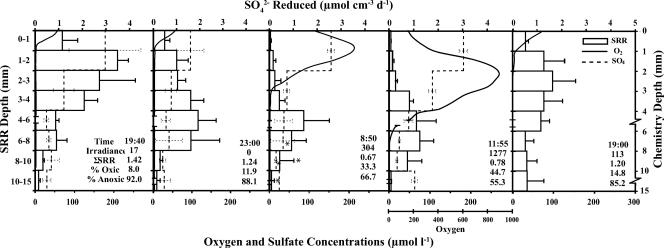
FIG. 2.
Vertical profiles of SRRs (hollow bars; an error bar denotes 1 standard deviation [n = 3] or a range [*; n = 2]), oxygen concentrations measured using microelectrodes (solid lines), and sulfate concentrations (dashed lines; an error bar denotes 1 standard deviation [n = 3 to 5] or a range [*; n = 2]) for samples collected in the Mushroom Spring microbial mat on 6 and 7 September 2003. Note breaks and changes in scale on the chemistry depth axis. Sampling times, means for irradiance measurements (photosynthetically available radiation, μE m−2 s−1), integrated SRRs (nmol cm−2 day−1), overall depths, and proportions of total SRRs above (% oxic) and below (% anoxic) the oxycline are in the inset. Note the different scale for the oxygen profiles for the 11:55 sampling point. No sulfate determinations were made for the 19:00 sample on day 2.

