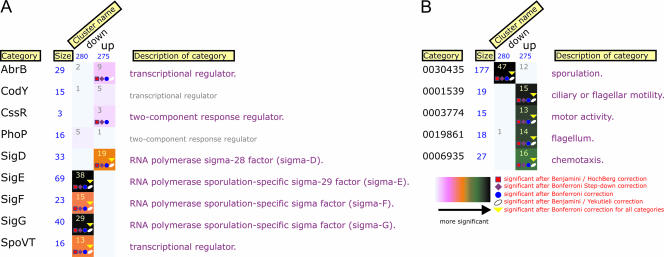
FIG. 1.
FIVA analysis of interaction and GO (gene ontology) categories of the transcriptome data. Genes from the DNA macroarray data set were divided into up- and downregulated clusters [comparison of gene expression ratios between B. subtilis 168(pKTH10)/B. subtilis 168]. “Interaction” (A) and GO (B) categories are shown. The size of each cluster is presented in blue underneath the cluster name. Numbers in rectangles represent how many genes were up- or downregulated per cluster in each category. The colors of square boxes depict the significance of gene enrichment per category as defined in the key. Detailed information on significance analyses is available in Blom et al. (4).

