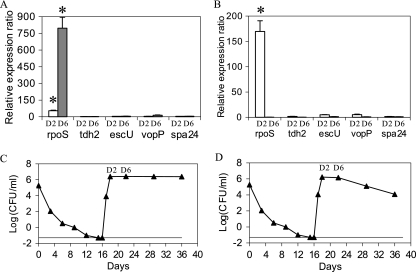
FIG. 2.
Mean relative expression ratios for five genes in ASW after temperature upshift. The temperature of ASW was increased from 4°C to 20°C (A and C) or 37°C (B and D). The levels of expression after 2 days (D2) and 6 days (D6) of temperature upshift were computed and were normalized according to the geometric mean of results obtained for two control genes, pvsA and pvuA. The data are the normalized means ± standard deviations of the results for two runs, each with three replicate samples. *, significant results (P < 0.05).

