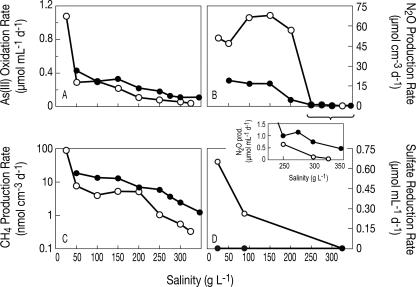
FIG. 4.
Potential rates of As(III) oxidation (A), denitrification (measured as N2O production) (B), methanogenesis (C), and sulfate reduction (D) versus total salinity in ML (open symbols) and SL (closed symbols) sediment slurries. The inset in panel D shows N2O production at salinities above 200 g liter−1 on a finer scale. Arsenite oxidation slurries were incubated 20 days for ML and 14 days for SL. Denitrification slurries were incubated 14 days for ML and 27 days for SL. Methanogenesis was measured in As(V) reduction slurries incubated 20 days for ML and 30 days for SL. Sulfate reduction slurries were incubated 7 days for both lakes.

