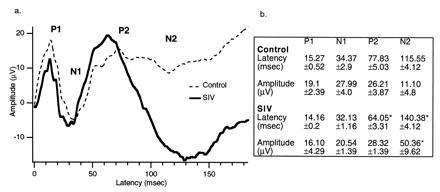
Figure 3.

VEPs. (a) VEPs from SIV-infected monkeys (n = 4) compared with controls (n = 5). The latencies obtained from SIV-infected monkeys are shorter than the VEPs from the control group. This figure also illustrates a large amplitude N2 wave uniquely appearing in the trace of the SIV monkeys. (b) Values of the latencies of both groups measured from the stimulus artifact (time = 0). ∗, P < 0.05.
