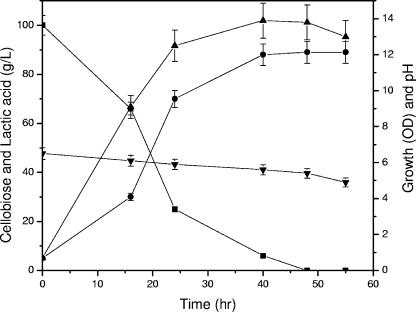
FIG. 1.
Profile of lactic acid production, growth, pH, and cellobiose utilization during fermentation by Lactobacillus delbrueckii mutant Uc-3 using cellobiose concentration of 100 g/liter. ▪, cellobiose; •, lactic acid; ▴, growth; ▾, pH. Error bars indicate standard deviations. Symbols with error bars that cannot be seen have standard deviations of 5 to 6%.

