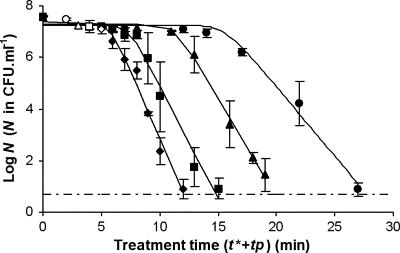
FIG. 2.
Survival curves for H. alvei subjected to temporal postdischarge time (tp) after different t*, including (⧫) 5 min, (▪) 4 min, (▴) 3 min, and (•) 2 min. For each curve, the open symbol indicates the beginning of postdischarge treatment. The values are means ± standard deviations for at least three experiments conducted with independently grown cultures. Solid lines, GInaFiT; dashed and dotted line, detection threshold.

