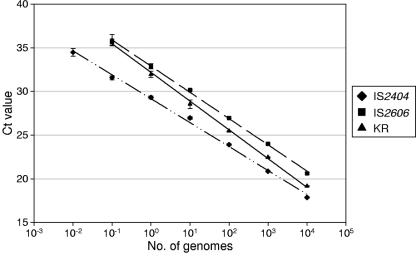
FIG. 1.
Standard curve generated using a logarithmic scale by the analysis of known amounts of genomic M. ulcerans DNA with the IS2404, IS2606, and KR TaqMan real-time PCR assays. Each 10-fold dilution was performed in quadruplicate, and the means of these replicates were used as data points. One standard deviation on either side of the mean is shown. The regression lines calculated for the data points for the IS2404, IS2606, and KR assays were as follows: y = −1.1892Ln(x) + 29.156, y = −1.3043Ln(x) + 32.886, and y = −1.428Ln(x) + 32.174, respectively. For each assay, the coefficient of correlation was greater than 0.99.

