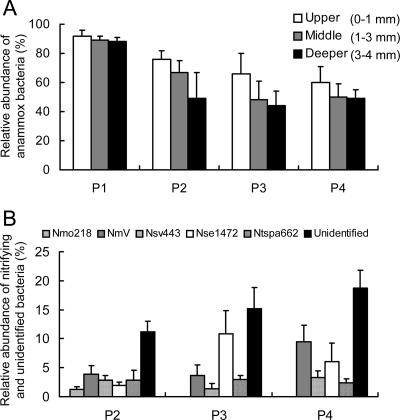
FIG. 4.
Relative abundance of anammox bacteria at different depths in the anammox biofilm (A) and of nitrifying and unidentified bacteria in the upper part of the biofilm (>1,000 μm) (B). Relative abundance is shown as the percentage of each probe signal in a microscopic field compared with the EUB338mix probe signal. The number of unidentified bacteria was calculated as the difference between the EUB338mix signal and the total signal from each specific probe. P1, P2, P3, and P4 refer to the biofilm sampling points, as shown in Fig. 1. The error bars indicate standard deviations.

