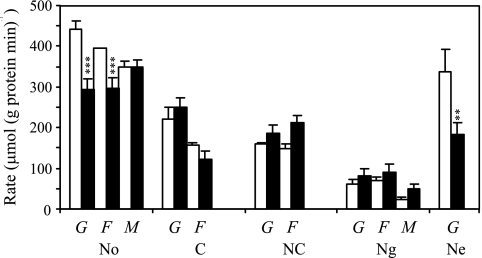
FIG. 2.
Comparison between zero trans-influx rates (open columns) and consumption rates (black columns) at an extracellular sugar concentration of 50 mM in cells from the diauxic shift (No) and after subsequent starvation (C, carbon starvation; NC, dual nitrogen and carbon starvation; Ng, nitrogen starvation with glucose; Ne, nitrogen starvation with ethanol). The sugars used were glucose (G), fructose (F), and mannose (M). Glucose consumption rates were obtained from Table 3, the zero trans-influx rates were measured by determining [14C]glucose uptake, and the protein content was measured by the method of Lowry et al. (24). The standard deviations are indicated by error bars. The differences between sugar consumption rates and uptake capacities were statistically evaluated by using a two-tailed Student t test. Significantly lower consumption rates compared to the uptake capacity are indicated by three asterisks (P < 0.01) and two asterisks (P < 0.02). The degrees of freedom were always more than 30.

