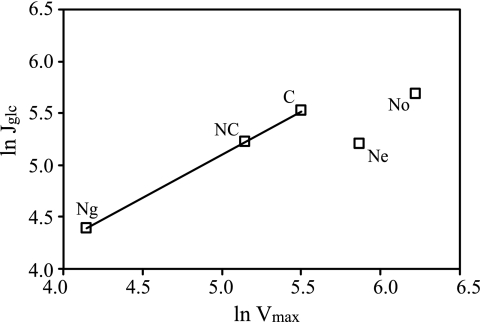
FIG. 3.
Plot of influx of glucose (Jglc) versus the maximal initial uptake rate (Vmax) for the diauxic shift (No) and for starved cells (C, carbon starvation; NC, dual nitrogen and carbon starvation; Ng, nitrogen starvation with glucose; Ne, nitrogen starvation with ethanol). The linear relationship for carbon-starved cells, nitrogen- and carbon-starved cells, and nitrogen-starved cells in the presence of glucose is indicated, with a slope of 0.83 (R2 = 0.999).

