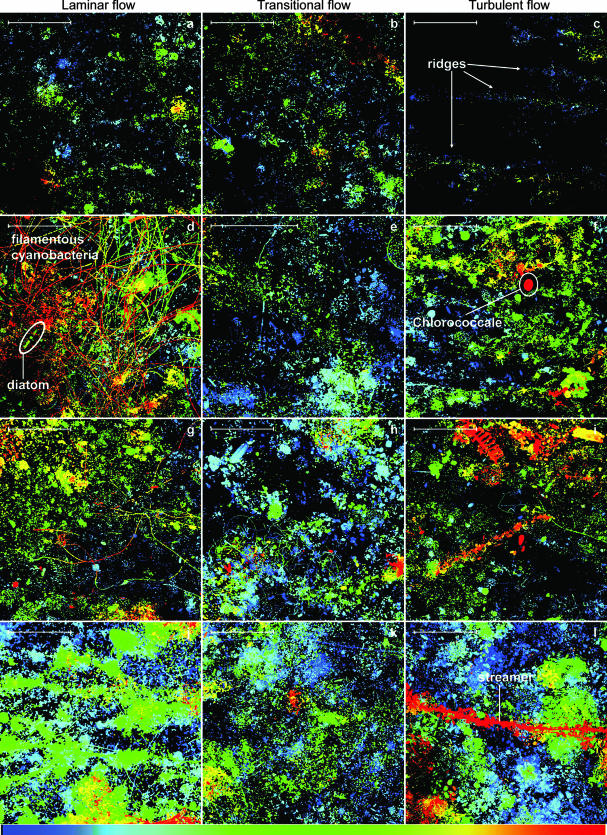
FIG. 2.
Nascent biofilm growth visualized by confocal laser scanning microscopy at day 6 (a to c), at day 11 (d to f), at day 16 (g to i), and at day 21 (j to l) of the experiment. Images are depth coded, with blue representing the base layer and red the canopy of the biofilms. The scale bars at the upper left corners represent 100 μm.

