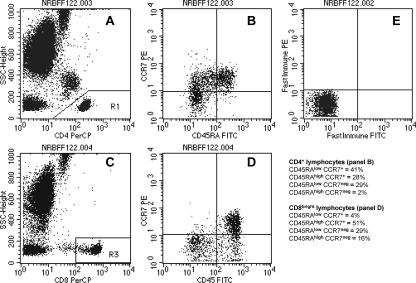
FIG. 2.
T-lymphocyte maturation phenotypes. (A) CD4+ lymphocytes are identified as low SSC cells with a high staining intensity in the FL-3 channel (CD4 PerCP). (B) At least 2,500 events in the CD4+ lymphocyte gate were analyzed for the expression of CD45RA and CCR7: upper right, naïve (CD45RAhigh CCR7+), upper left, central memory (CD45RAlow CCR7+), lower left, effector memory (CD45RAlow CCR7−), and lower right, terminally differentiated effector memory expressing CD45RA (CD45RAhigh CCR7−); a typical distribution pattern is displayed. (C) CD8bright lymphocytes were identified as low SSC cells with a fluorescence intensity above 100 arbitrary units in the FL-3 channel (CD8 PerCP). (D) At least 2,500 events in the CD8bright lymphocyte gate were analyzed for the expression of CD45RA and CCR7; a typical distribution pattern is displayed. (E) Markers for the discrimination of T lymphocyte maturation phenotypes were set using a highly purified mouse IgG isotype control to define the boundary between CCR7+ (upper left and upper right quadrants in panels B, D, and E) and CCR7− (lower left and lower right quadrants). The boundary on the FL-1 axis was fixed at 100 arbitrary fluorescence units in order to identify cells with high CD45RA staining intensities (upper right and lower right quadrants). The quadrant statistics yield the percentages of the T-cell maturation phenotypes for CD4+ (B) and CD8bright (D) lymphocytes.

