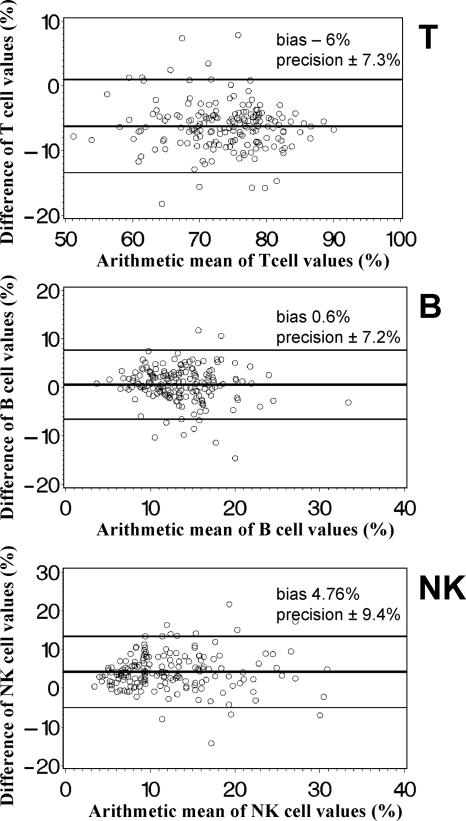
FIG. 3.
Bland-Altman diagrams (4) of the relative distribution of T-, B- and NK-lymphocyte subpopulations determined by an SP lyse-no-wash FCM method (MultiSET) and a simplified T1, DP lyse-and-wash method. The arithmetic mean of the lymphocyte percentages (SP FCM plus DP FCM/2) is displayed on the x axis, and the difference of the lymphocyte percentages (SP FCM minus DP FCM) on the y axis. The horizontal lines indicate the mean difference (bias) ± 2 SD (precision) of simultaneous measurements with both methods of samples from 177 adults.

