FIG. 1.
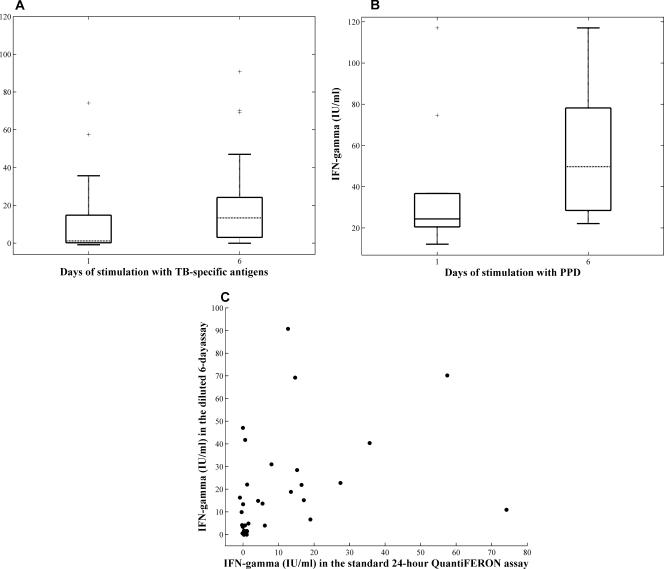
Comparison of IFN-γ production after 24 h and 6 days of incubation with the antigens. (A) Whole blood from 33 TB contacts was tested with the TB-specific antigens in 24-h and extended 6-day IFN-γ assays. The box plots represent the median, lower, and upper quartiles of IFN-γ values after 24 h and 6 days of stimulation after subtraction of the negative control values. Lines extending from each end of the box show the extent of the rest of the data (1.5× interquartile range), and crosses represent outliers. (B) Whole blood from 14 subjects was stimulated with PPD for 1 or 6 days. (C) Scatter plot representing the correlation between 24-h undiluted and extended 6-day diluted IFN-γ assays (Spearman's rho = 0.5, P < 0.001).

