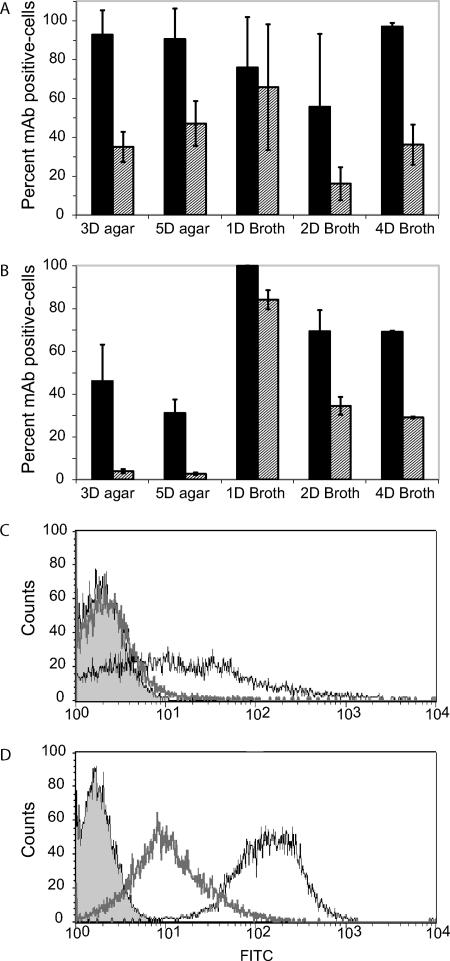
FIG. 8.
Expression of epitopes in GXM for MAbs 12A1 and 21D2 under different growth conditions. (A and B) Percentage of cells stained positive for either MAb 12A1 (solid bars) or 21D2 (gray hatched bars) as determined by FACS analysis. Error bars represent the standard errors. (A) Serotype D strain B-3501; (B) serotype C strain 106.97. The growth conditions are listed by the number of days (D) of incubation and the medium used (agar or broth). Data are averages of two to three experiments. (C and D) Histograms from a representative experiment of the FACS data obtained for MAb 21D2 (thick gray line, unfilled) and MAb 12A1 (thin black line, unfilled) after 3 days of growth on agar (C) and 1 day of growth in broth (D) for strain 106.97. The unstained population is represented by the filled area.

