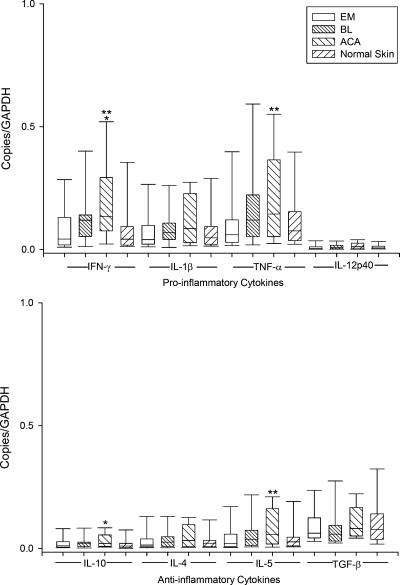
FIG. 4.
mRNA expression of proinflammatory and anti-inflammatory cytokines in 64 EM lesions, 11 BL lesions, 25 ACA lesions, and 25 normal skin samples relative to the GAPDH gene. Data are shown in box plots in which the boxes represent the 25th and 75th percentiles, the lines within the boxes represent the median values, and the lines outside the boxes represent the 5th and 95th percentiles. A difference between normal and lesional skin (*) or between EM and ACA lesions (**) at the 0.05 level is indicated above the bars. mRNA expression of the proinflammatory cytokines IFN-γ, IL-1β, and TNF-α was greater than of the anti-inflammatory cytokines IL-10, IL-4, IL-5, and TGF-β.

