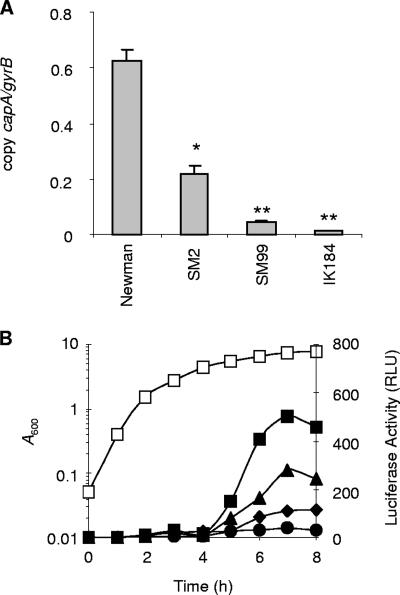
FIG. 6.
Expression of capA in Newman and its derivatives. (A) Quantitative transcript analysis of capA by LightCycler RT-PCR of strains Newman, SM2 (ΔspoVG), SM99 (arlR), and IK184 (ΔrsbUVW-sigB) grown for 8 h at 37°C in LB. Transcripts were quantified in reference to the transcription of gyrase (in numbers of copies per copy of gyrB). Values from two separate RNA isolations and two independent RT-PCRs each were used to calculate the mean expression levels (± standard errors of the mean). *, P < 0.05 for derivative versus Newman; **, P < 0.01 for derivative versus Newman. (B) Growth curve of Newman (open squares) and transcriptional activity of the capA promoter in plasmid pSTM04-carrying strains Newman (squares), SM2 (triangles), SM99 (diamonds), and IK184 (circles). capA promoter activity was determined by measuring the luciferase activity of the capAp-luc+ fusion. Shown are representative results for at least three independent experiments.

