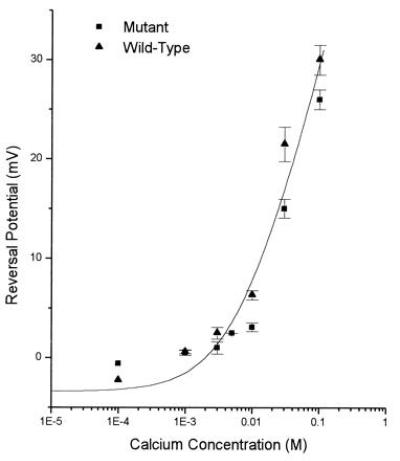
Figure 5.

Permeability of calcium through wild-type and mutant NMDA channels. Reversal potential is plotted as a function of extracellular calcium concentration. Triangles are data from wild-type channels and circles from mutant channels. Permeability ratio PCa/PNa was calculated to be 11 for wild type and mutant using Eq. 9, which provides a smooth fit of the data.
