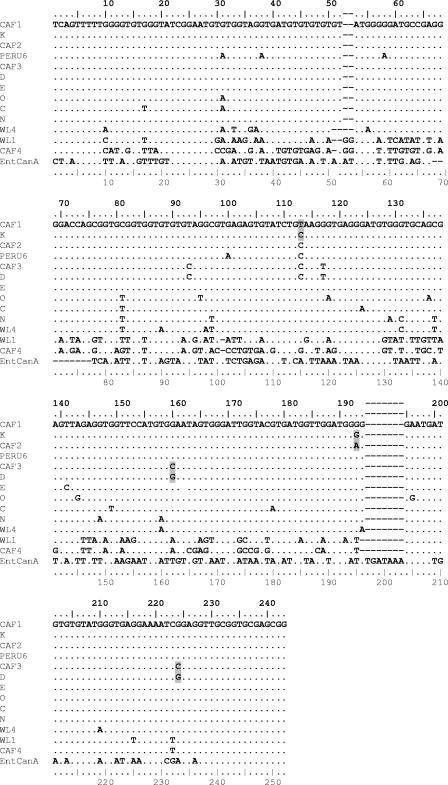
FIG. 1.
Sequence alignment of the ITS region of the rRNA gene of E. bieneusi genotypes using the Multalin software. New sequences from Gabon and Cameroon (CAF1 to CAF4) are compared to sequences representative of each group. (Representative sequences are the following: group 1, subgroup 1a, genotype D; group 1, subgroup 1b, genotype Peru6; group 1, subgroup 1c, genotype K; group 1, subgroup 1d, genotype E; group 1, subgroup 1e, genotype O; group 1, subgroup 1f, genotype C; group 2, genotype N; group 3, genotype WL4; group 4, genotype WL1; and the outlier sequence EntCanA). Dots indicate identity to CAF1. Point mutations of the new sequences CAF1, CAF2, and CAF3 compared to their closest homologues, K and D, are shaded gray (for accession numbers, see Table 2) (note that the upper ruler indicates the true sequence position for group 1 genotypes [243 bp], and the lower ruler indicates the Multalin alignment position number, with gaps counted).

