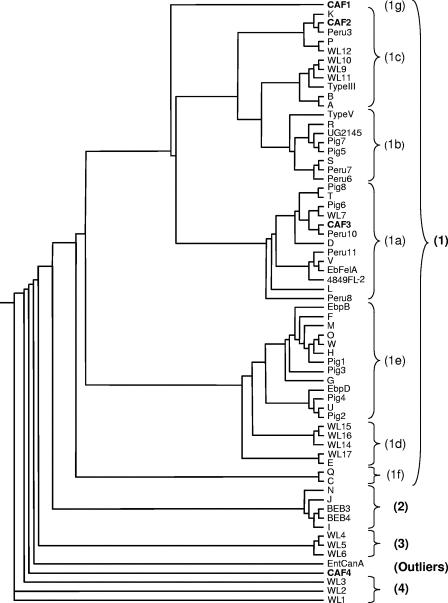
FIG. 2.
Unrooted phylogram inferred by the maximum-likelihood analysis of the ITS of E. bieneusi genotypes. The phylogram was constructed using the Phyml software. Groups and subgroups are indicated in parentheses. New genotypes from this study are in boldface (for accession numbers, see Table 2).

