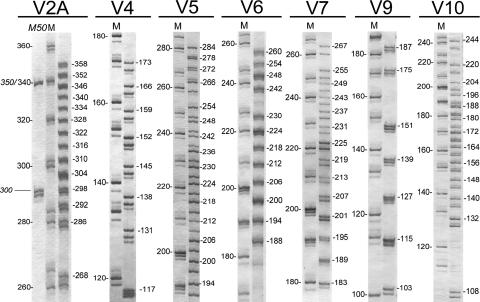
FIG. 1.
DGE separation of the VNTR types for each of the seven MLVA markers investigated. The representative amplicons of each size group were amplified separately and mixed prior to electrophoresis. This mixture was loaded close to the 20-bp step ladder (lanes M). For V2A, an additional 50-bp step ladder was used (lane M50). The amplicon length of only the representative band of each size variant determined by DNA sequence analysis is marked. The real dimensions of the gel fragments shown were transformed proportionally to support the highest printout resolution.

