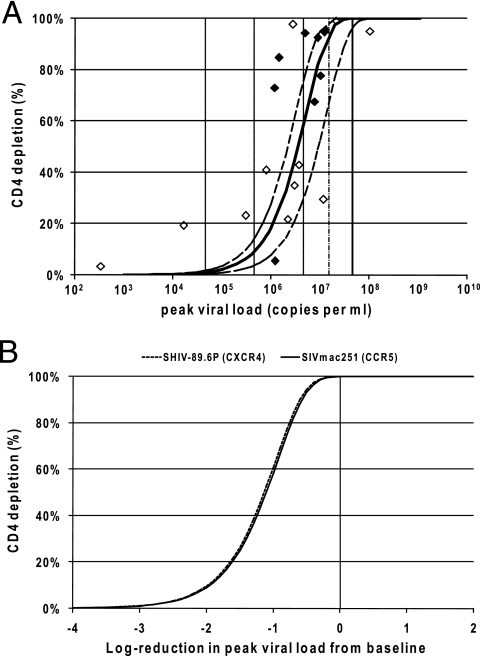
FIG. 3.
(A) The predicted relationship between peak viral load and CD4+ T-cell depletion in acute SIVmac251 infection (mean, solid curve; 95% confidence interval, dashed curves) is shown. The diamond points represent the experimental data from the 20 macaques (filled diamonds correspond to monkeys in which the peak viral load may not have been reached and the unfilled diamonds correspond to monkeys in which the peak viral load had been reached). The solid black line segment refers to the geometric mean peak viral load in control animals challenged with SIVmac251. The vertical lines indicate the effects of different reductions in peak viral load (the thin line curve refers to a threefold reduction in viral load, and the dashed curves refer to 1-log10, 2-log10, and 3-log10 reductions in viral load). The predicted relationship is calculated by the following equation: proportion of CD4 depleted  , where tp is the time of viral peak, Vp is the viral peak value, and dv is the rate of postpeak viral decay (1.49 day−1) (5), and the proportion depleted is calculated by the equation (baseline CD4 − minimum CD4)/baseline CD4. Note that for illustration, the viral peak for each monkey is used to provide a single data value (diamonds), but all viral load values for each animal are used in the simulations in calculating predicted infection dynamics and optimal infectivity rates. (B) Relationships between CD4+ T-cell depletion and reduction in peak viral load are compared between the CCR5-tropic SIVmac251 (solid curve) and CXCR4-tropic SHIV89.6P (dashed curve) viruses. The curves are aligned to show the effect of reducing the viral load from the average peak viral load in controls (zero reduction, represented by the solid line, is associated with the average viral peak in each of the respective viral infections). The rate of infectivity, viral decay rate, and time of viral peak resulting from infection with each virus contributes to the relationship between viral peak and depletion of CD4+ T cells; our presented relationships were found to be robust to changes in the viral decay rate and time of viral peak (but primarily influenced by the rate of viral infectivity).

