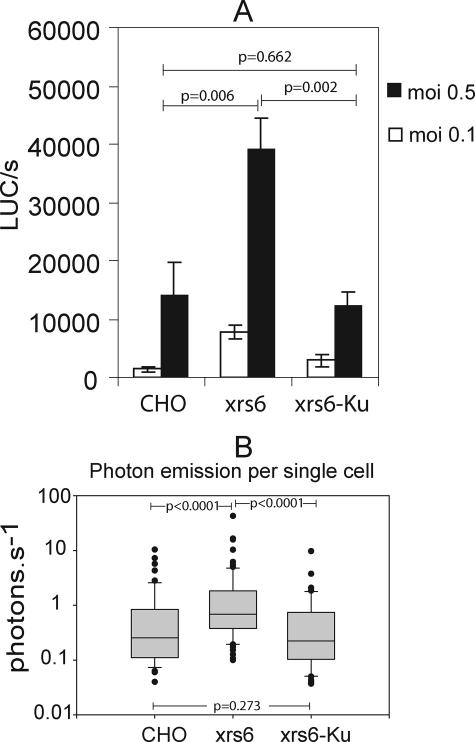
FIG. 3.
Measurement of transgene expression by bioluminescence emission in single cells. Cells were infected with NL4-3Δenv-luc VSV-G virus, and the luciferase activity was quantified both in cell lysates and in isolated cells. (A) Overall, luciferase activity in lysates following infection at MOIs of 0.1 and 0.5. The results are expressed in light units, and values reported are given as the means for three independent experiments. Errors bars represent the standard deviation. Comparisons among data sets obtained at an MOI of 0.5 were performed by an independent sample t test with a probability of error threshold of 0.05. P values obtained for an MOI of 0.1 were comparable. (B) Quantification of photon emission per second in single cells (n = 50/per cell type). Lines within the boxes indicate the means. The lowest boundaries of the boxes indicate the 25th percentile, and the upper boundaries indicate the 75th percentile. Whiskers above and below the boxes indicate the 9th and 10th percentiles. All of the outlying points are plotted. Comparisons among data sets were performed by Mann-Whitney U test, with a probability of error threshold of 0.05. All of the statistical calculations and graphs were done with SigmaPlot software (Science Products).

