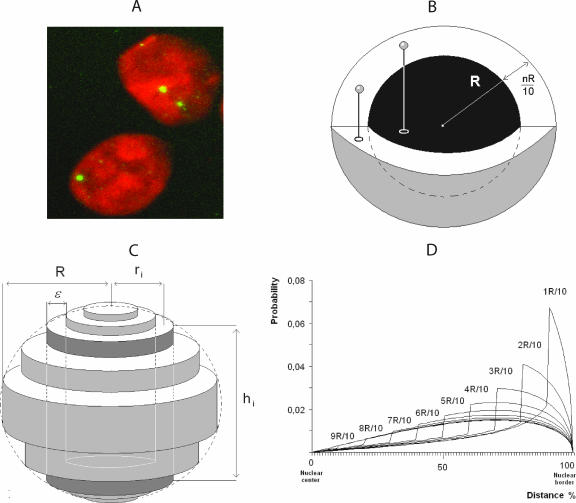
FIG. 5.
FISH analysis of retroviral vector integration. (A) Imaging of nuclei from transduced cells. Cells were infected with the lentiviral vector pSINgfp and cultured for 2 months before FISH analysis. Nuclei were counterstained with propidium iodide. Individual integrated events are revealed by hybridization with a specific Alexa Fluor 488-labeled probe. (B) Peripheral distributions were modeled by random distribution in shells whose thickness was nR/10 (1 < n < 10). (C) Reconstruction of nuclear volume from a 2D image. The sphere (R radius) was fitted by a set of cylinders (each cylinder was defined as the mean radius = ri, height = hi, and thickness = ɛ, with ɛ = R/10). In the example shown in the figure, hi and ri refer to the third cylinder starting from the center of the sphere. (D) Model of signal distribution in shells of different thicknesses relative to the distance from nuclear border.

