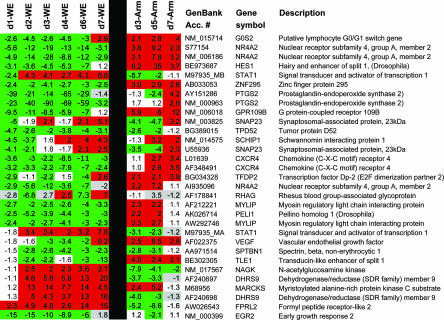
FIG. 2.
Gene expression profiles distinguish between infection with hemorrhagic fever virus and infection with a benign virus. Blood was obtained from rhesus macaques on the days indicated, and the most prominent differentially expressed genes between the two viruses are represented here. Animal numbers are as described for Fig. 1, so for days 1 and 6 the geometric mean of data from two animals is presented. In addition to the 31 genes depicted here, there are approximately 450 genes that distinguish these two infections with a P value confidence level of <0.05 (see Tables SI to SV in the supplemental material). Differential expression, i.e., the level of a gene's expression after infection normalized to its expression level before infection, is shown. The green color represents downregulated gene expression, and the red color represents upregulated gene expression. White values are below the level of ±twofold deviation from baseline, and gray values are below white values in detection quality. Days postinfection (d1, etc.) are indicated.

