
Figure 1.
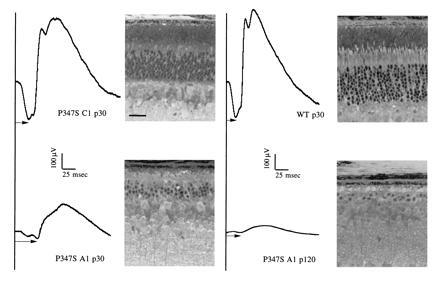
ERG recordings and matching histology of transgenic and control mice. The ages are indicated in postnatal days (e.g., p30). Arrows indicate the measurement of a-wave implicit times. A range of 18–28 msec is typically observed for wt mice. (Bar = 25 μm.)