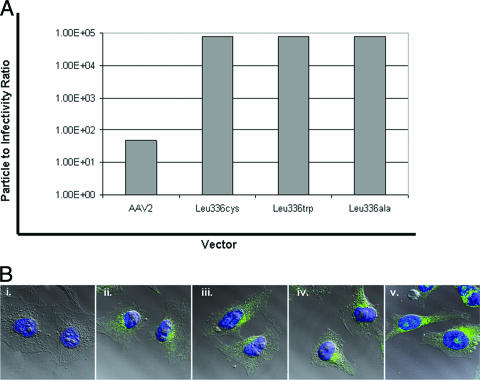
FIG. 6.
(A) Infectious-center assay data to assess the particle-to-infectivity ratio between wt AAV2 virions and the Leu336 mutant virions. (B) Confocal-microscopy images of (i) A20 negative control and (ii) AAV2-ala-, (iii) AAV2-cys-, (iv) AAV2-trp-, and (v) wt AAV2-infected HeLa cells. MAB A20 was used to assess the locations of the virions 4 h postinfection.

