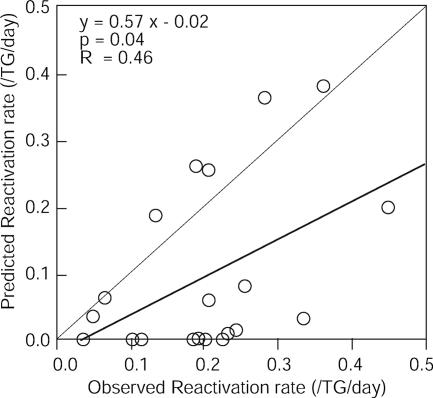
FIG. 7.
Mathematically predicted reactivation rates correlate significantly with observed reactivation rates. Forty mice were infected with HSV-2. The reactivation rates predicted based on the latent viral loads and the numbers of CD8+ T cells are plotted on the y axis, and the observed reactivation rates are plotted on the x axis. The thick line indicates the linear regression between predicted and observed reactivation rates, and the thin line represents the expression y = x, which is the reactivation rate predicted from the model. The equation, P value, and R value for the linear regression analysis are shown.

