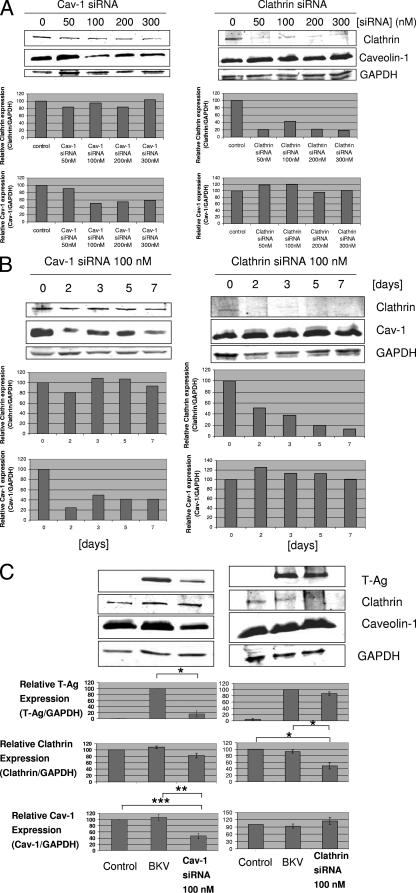
FIG. 5.
Cav-1 siRNA decreased BKV infection of HRPTEC, whereas clathrin siRNA was ineffective. Levels of Cav-1 and clathrin expression were analyzed by WB. Relative T-Ag, Cav-1, and clathrin expression levels were calculated as the ratio between the intensities of the T-Ag, Cav-1, or clathrin bands and the GAPDH band (equal loading control) measured by using the Odyssey system, and the results were presented as graph bars. Means and SE were calculated from the results of at least two independent experiments. *, P < 0.01; **, P < 0.03; ***, P < 0.05. (A) Dose dependence of siRNA transfection. HRPTEC were transfected with 50 to 300 nM of either Cav-1 siRNA or clathrin siRNA. At 48 h after transfection, cells were harvested and analyzed by WB. (B) Time course of 100 nM and 200 nM Cav-1 siRNA transfection. HRPTEC were transfected with 100 nM Cav-1 and clathrin siRNA. Cells were harvested at 2, 3, 5, and 7 days after transfection and analyzed by WB. (C) Cav-1 siRNA transfection interfered with BKV infection. HRPTEC were transfected with 100 nM either of Cav-1 or clathrin siRNA. HRPTEC were incubated with BKV at 2 days after administration of Cav-1 or clathrin siRNA, fresh medium was added 5 days after siRNA transfection, and cells were harvested 7 days after transfection. Control, HRPTEC neither incubated with BKV nor transfected with siRNA. BKV, HRPTEC incubated with BKV but not transfected with siRNA.

