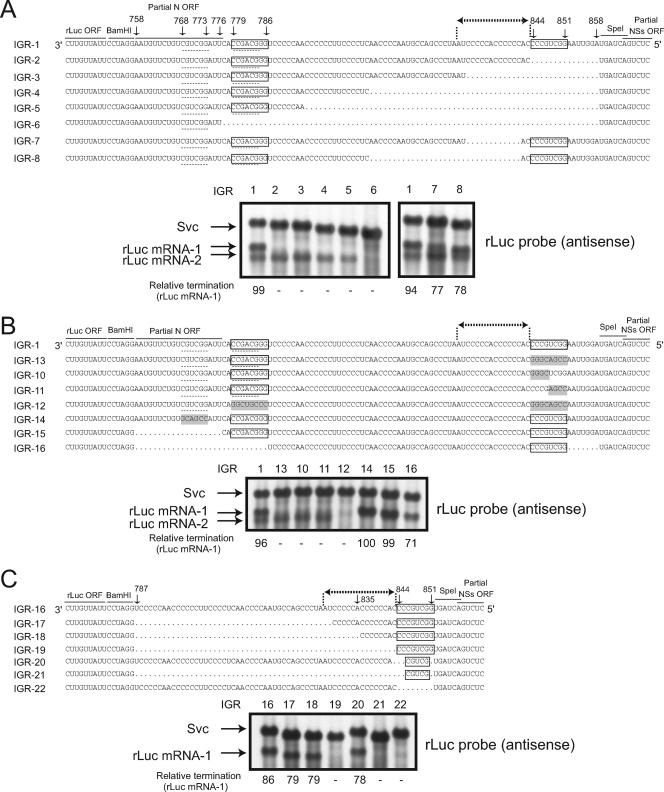
FIG. 7.
Analysis of N mRNA transcription termination control. The S-IGR sequences in IGR-1 to IGR-8 (A), IGR-1 and IGR-13 to IGR-16 (B), and IGR16 to IGR-22 (C) are shown. The conserved 3′-CCCGUCGG-5′ and 3′-CCGACGGG-5′ sequences are boxed. Dotted lines highlight a 6-nt sequence (5′-CGUCGG-3′) that is complementary with the 3′-CCGACGGG-5′ sequence (see Discussion). The N mRNA termination site is denoted by dotted lines with terminal arrows. Shading indicates mutations that were introduced into IGR-10, IGR-11, IGR-12, IGR-13, and IGR-14. Intracellular RNAs were extracted from subconfluent BHK/T7-9 cells that were transfected with pT7-vN, pT7-vL, pCAGGS-vG, and plasmids carrying each minigenome at 48 h posttransfection. Northern blot analysis was performed using an rLuc probe that bound to the sense rLuc gene ORF to detect the anti-virus-sense minigenome (Svc) as well as rLuc mRNA-1 and rLuc mRNA-2. The nucleotide positions of the S-IGR and the partial N ORF from the 3′ end of the virus-sense S segment are shown. The intensities of the rLuc mRNA-1 signal and the Svc signal of each minigenome were quantitated by densitometric scanning, and the abundance of rLuc mRNA-1 was normalized to that of Svc. These are shown as percentages of the Svc signal (relative termination) below each lane.

