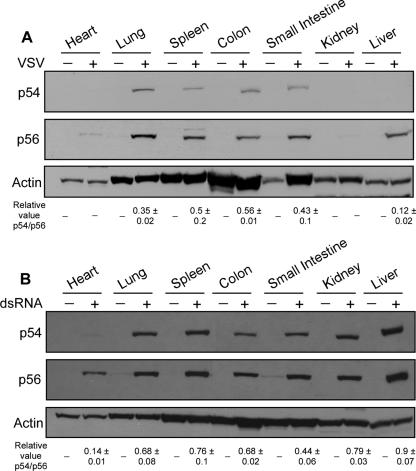
FIG. 2.
Profiles of p54 and p56 protein expression following VSV and dsRNA injection. Mice were injected with PBS or VSV (A) or dsRNA (B), and after 8 h multiple organs were removed and protein extracts subjected to Western blotting with murine p56 and p54 polyclonal antibodies. The number at the bottom of each lane shows the mean and standard deviation of the relative p54/p56 value. Two independent experiments for panel A and three independent experiments for panel B were done.

