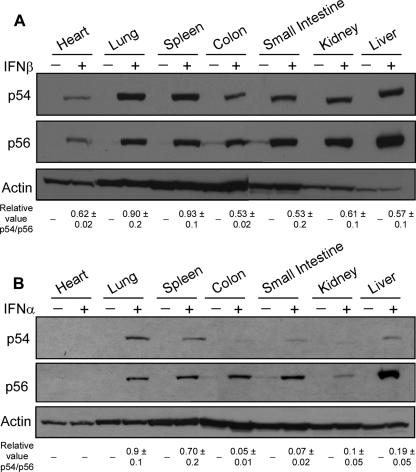
FIG. 4.
Profiles of p54 and p56 protein expression following IFN-β and IFN-α injection. Mice were injected with PBS, IFN-β (A), or IFN-α (B), and after 8 h multiple organs were removed and protein was extracted. p54 and p56 protein levels were analyzed by Western blotting. Data are means ± standard deviations of relative values of the p54/p56 ratio after stimulation. Results shown are means of three independent experiments.

