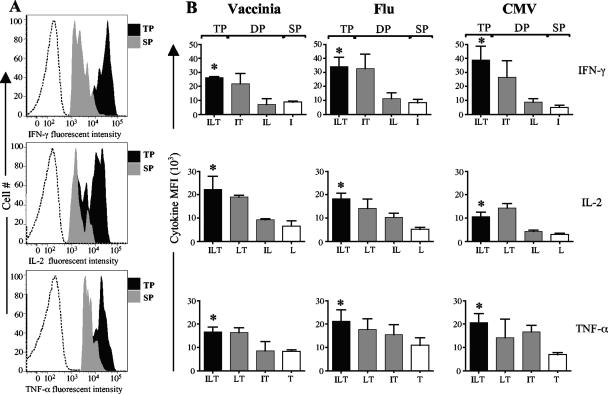
FIG. 4.
Triple producers produce higher levels of cytokine per cell than single producers. (A) Representative plots showing the fluorescence intensities for IFN-γ, IL-2, and TNF-α from triple producers (TP) and single producers (SP). Dotted lines represent data for the isotype control. (B) Summary of mean fluorescence intensities (MFI) for vaccinia virus-, flu virus-, and CMV-specific triple producers, double producers (DP), and single producers. I, IFN-γ; L, IL-2; and T, TNF-α. Note that for double and single producers, only the dominant subsets in each virus-specific group are shown. Asterisks, significantly higher than single producers.

