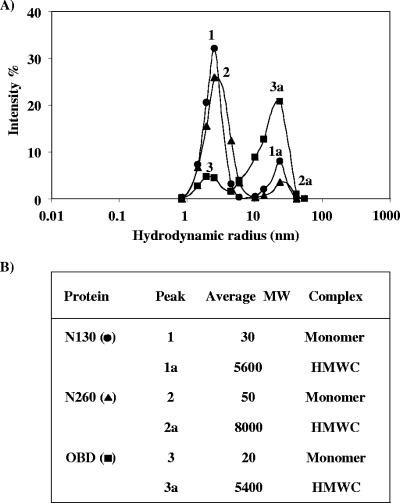
FIG. 2.
DLS analysis of N130, OBD, and N260. (A) The graph represents the scattering intensity (fraction of total scattering) as a function of the hydrodynamic radii obtained for the N130, OBD, and N260 proteins at a concentration of 10 μM. Each curve represents an average of 20 measurements. (B) Molecular weight (MW) and types of complexes estimated from each hydrodynamic radius.

