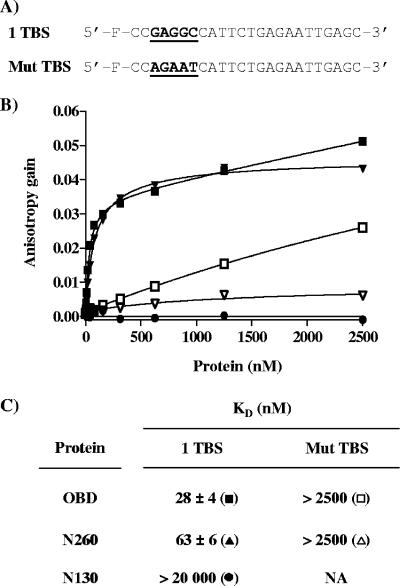
FIG. 4.
Binding of the N130, OBD, and N260 proteins to DNA measured by fluorescence anisotropy. (A) Probes used in this study. Nucleotide sequences (underlined and in boldface) of the probe containing a single TBS (1 TBS) and of the control nonspecific probe containing a mutated TBS (Mut TBS). (B) Binding isotherms were performed either with the TBS probe (filled symbols) or with the control probe (open symbols) and increasing concentrations of the OBD (squares), N260 (triangles), and N130 (circles) proteins. For each isotherm, 15 nM of duplex DNA probe was incubated with increasing concentrations of N130, OBD, or N260 protein in triplicate. Error bars are not visible on the graph, as they are smaller than the symbols. (C) KD values for the N130, OBD, and N260 proteins for the specific and nonspecific probe were calculated from the data by nonlinear regression and fitting to a one-binding-site equilibrium. The values and standard deviations reported were calculated from over 20 independent binding isotherms, with each data point performed in triplicate.

