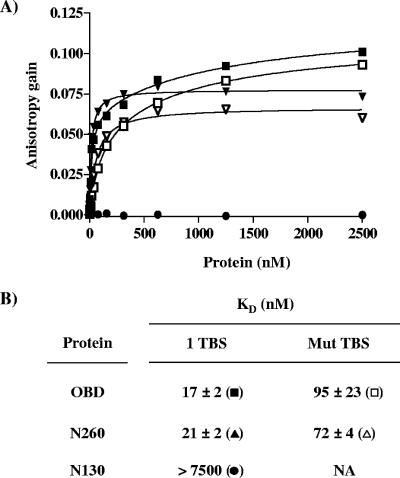
FIG. 5.
Effect of pH and ionic strength on the binding of the OBD and N260 proteins to DNA. (A) Effect of pH. Binding isotherms were performed as described for Fig. 4 but at the lower pH of 6.8. Binding isotherms were performed either with the TBS probe (filled symbols) or with the control probe (open symbols) and increasing concentrations of the OBD (squares), N260 (triangles), and N130 (circles) proteins. (B) KD values for the OBD and N260 for each probe at pH 6.8. Standard deviations were calculated from two independent binding isotherms, with each data point done in triplicate.

