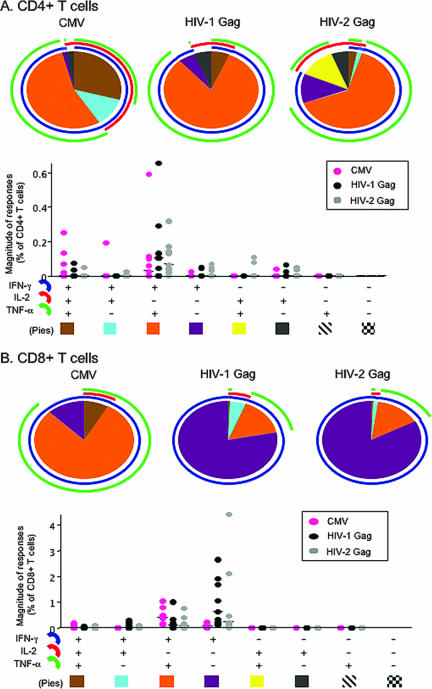
FIG. 2.
Cytokine profile of CD4+ (A) and CD8+ (B) T-cell responses recognizing HIV Gag- and CMV pp56 in HIV-1/2 dually infected subjects (n = 9). Antigen-specific responses of >0.02% of the total CD4+ or CD8+ T cells producing each cytokine were considered positive. Each pie chart represents the mean responses of all subjects to the HIV-1, HIV-2 Gag, and CMV pp56 overlapping 15 mers. Responses are grouped by cytokines secreted and matched to the pattern in the legend. The arc outside the pie chart indicates the mean percentage of HIV-1-, HIV-2-, or CMV-specific IFN-γ (blue)-, IL-2 (red)-, or TNF-α (green)-producing cells. The dot plots represent the mean magnitude of response to CMV, HIV-1, and HIV-2 Gag with multiple functional cytokine profile indicated in the legend. Each “+” in the legend denotes IFN-γ, IL-2, and TNF-α positivity.

