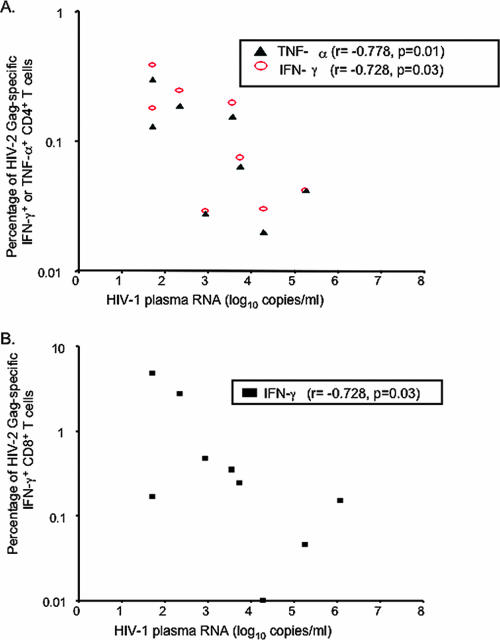
FIG. 3.
Negative correlation between the frequencies of HIV-2 Gag-specific IFN-γ+ or TNF-α+ CD4+ (A) and IFN-γ+ CD8+ (B) T cells with HIV-1 plasma viral load in dually infected subjects. A Spearman ranking test was used to analyze the correlation. Positive responses were designated when the percentage of bright cytokine+ CD4+ or CD8+ T cells was twice that of the negative control and >0.02% of the total CD4+ or CD8+ T cells. Antigen-specific responses of <0.01% are shown as 0.01% on the figures.

