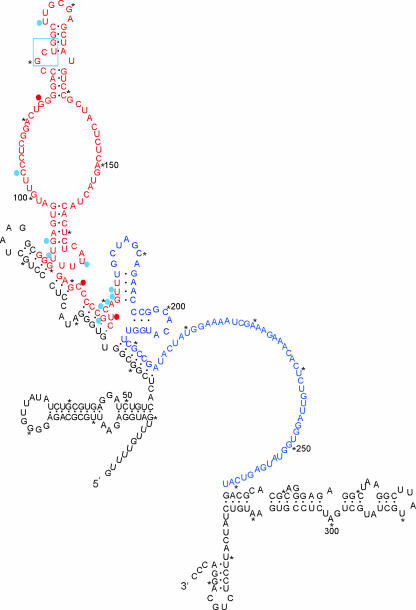
FIG. 4.
Distribution of indels observed in planta and relationship to D4 satRNA secondary structure (revised from reference 18). The nonstop regions A and B are shown in red and blue, respectively. Deletions are indicated with blue circles or red circles (for hot spots). The nucleotide number is arbitrary when deletions occurred in runs of a single nucleotide. The box marks the nucleotides involved in the 4-base insertion event.

